

Looker vs Tableau: Which Is The Best BI Tool for Your Needs?
Business intelligence (BI) is the foundation of data-driven business decisions. It combines analytical data, its visualizations, as well as the use of the appropriate tools for more effective and efficient decision-making.
There is a wide range of BI tools available in the market.
In today's article, we will focus on two of these tools, Looker and Tableau.
In particular, in today's guide we will see:
- What is Looker?
- What is Tableau?
- How do they differ from each other?
Before we dive in, let's start with two basic definitions.
What is Looker?
Looker is a data visualization tool and is part of the Google Cloud Platform (GCP), along with other tools such as BigQuery.
The tool is designed for use by businesses of all sizes.
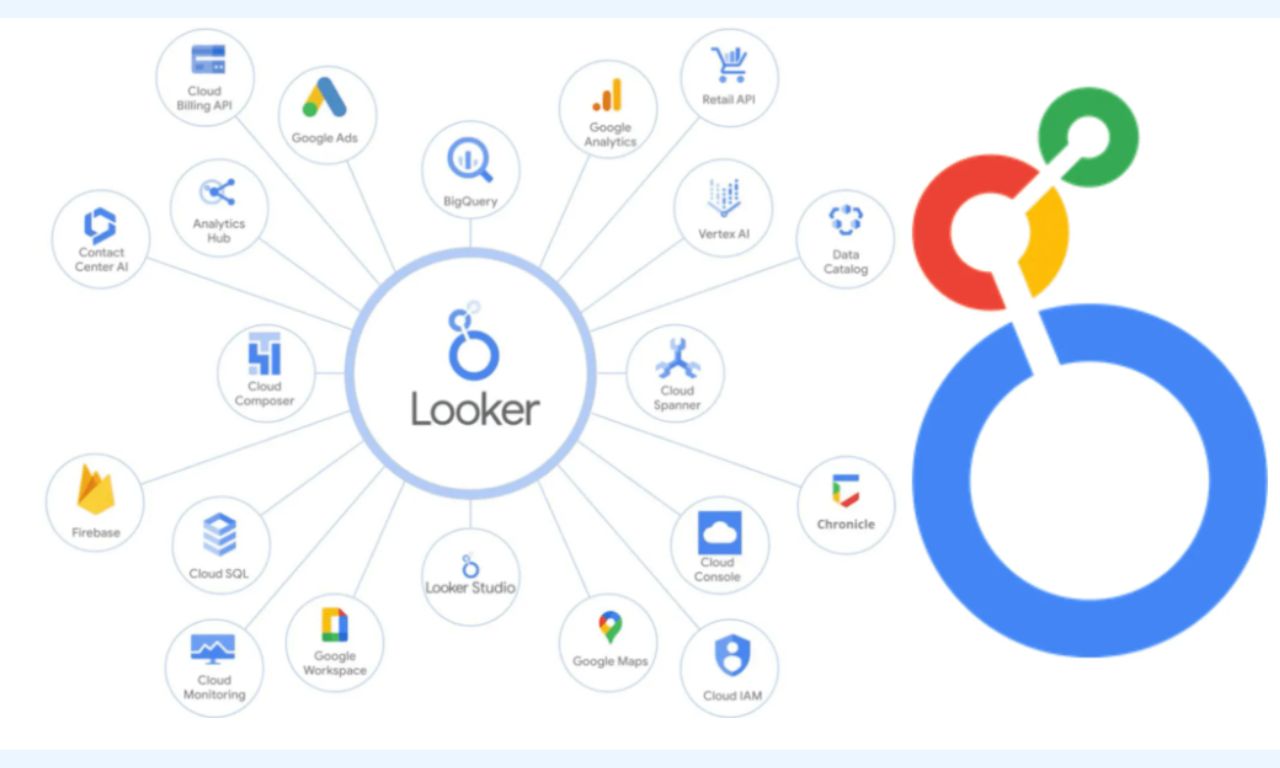
Organizations and businesses use Looker (formerly Google Data Studio) to create dashboards and detailed reports.
Through the ability to visualize this data, they can and do transform the information into understandable and detailed graphs and tables to make informed and strategic decisions.
Looker has a user-friendly interface, allowing users to explore the data without the need for technical expertise.
A structural feature of Looker is LookML (short for Looker Modeling Language) which enables members of the data team to create semantic data models.
The main features of Looker that make it special are as follows:
- A platform that integrates seamlessly with existing BI solutions and tools
- The aforementioned Looker Modeling Language (LookML) which allows the creation of custom apps
- Embedded tools for data analysis that provide users with real-time data
Version control, so that every user in an organization is fully aware of the changes implemented, as well as when and why they were made
What is Tableau?
Tableau is a data visualization program used by a company's data analysts to visualize data in a simple and understandable way.
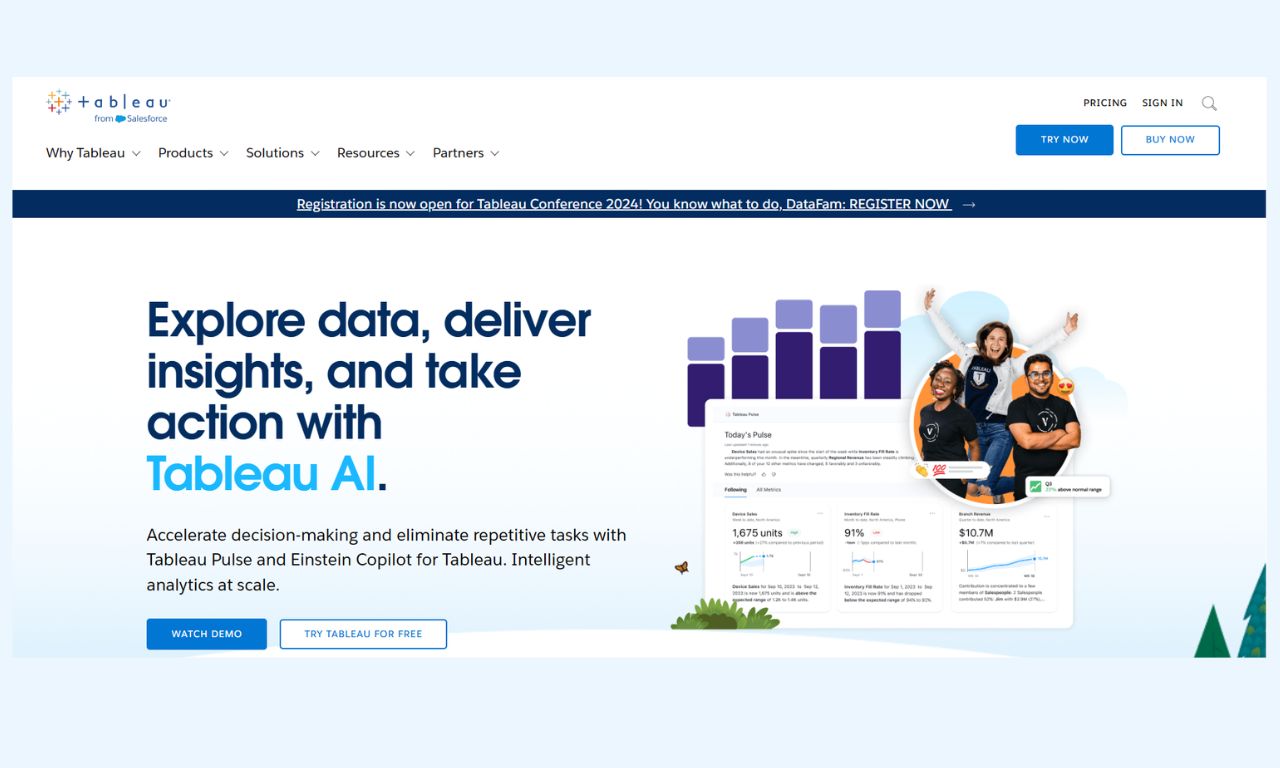
In addition to data visualization capabilities, Tableau provides the ability for enhanced analysis, fast data processing, statistical calculations, and predictive data modeling.
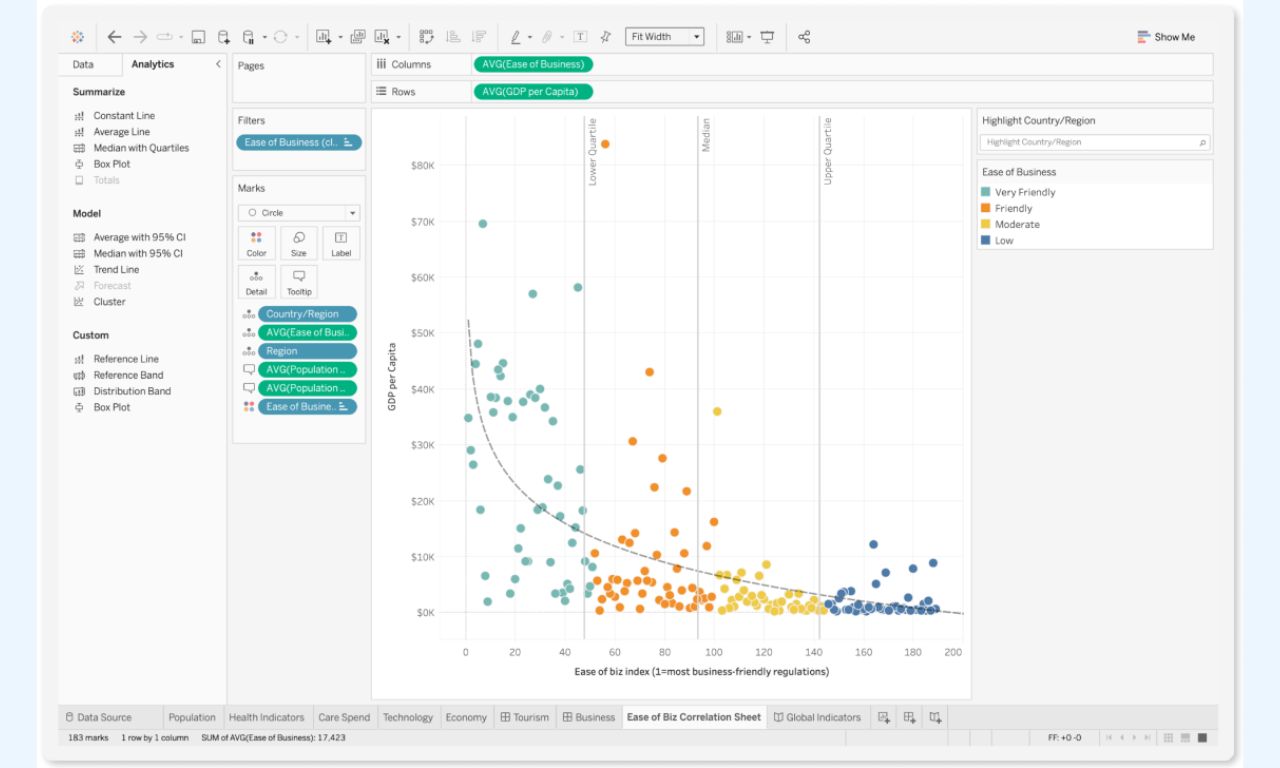
Tableau offers a comprehensive suite of tools for data visualization and analysis, including a desktop application known as Tableau Desktop.
Tableau Desktop allows users to create and customize their data visualizations and can be used in conjunction with Tableau Server or Tableau Cloud to publish and share visualizations with other users.
Some of the key features of Tableau are:
- Ability to integrate its platform into the Cloud, Slack, or natively integrate into Salesforce CRM
- Strong analytical capabilities with real-time data analysis so users have up-to-date information instantly
- Easy to use platform even for non-technical users
After seeing some basic information about Looker and Tableau, let's see how they differ and which one to choose based on your business needs.
Looker vs Tableau: What are the Differences?
Looker and Tableau are both powerful data visualization and analysis platforms, but there are some key differences between them.
Their main differences are as follows:
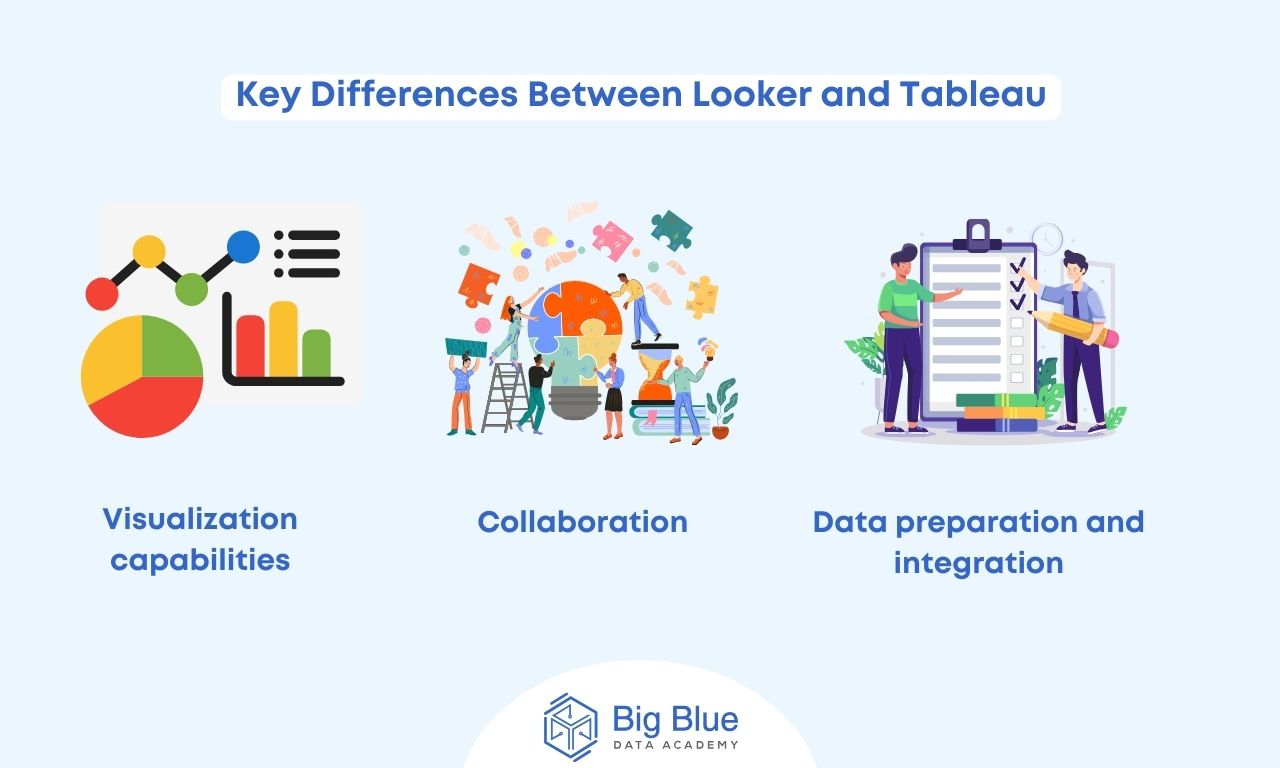
Difference #1: Visualization capabilities
Looker is a powerful and user-friendly platform, making creating visualizations simple and efficient.
However, Looker has some limitations in terms of visualization capabilities, such as limitations in accommodating different types of visualizations.
Tableau is considered a leader in data visualization, offering many visualization options such as heatmaps and scatterplots.
At the same time, it is constantly enhancing its platform by integrating AI and Machine Learning for analytics purposes.
Difference #2: Collaboration
Tableau offers quick dashboard integration for apps in Salesforce and SharePoint but lacks git integration.
On the other hand, Looker supports Version Control systems built into Git, providing powerful version management and collaboration capabilities.
Difference #3: Data preparation and integration
Tableau includes Tableau Prep for cleaning, organizing, and preparing data.
It can also connect seamlessly to ODBC / JDBC-based databases.
On the other hand, Looker offers a code-first environment for data governance and data integration into the platform.
It can also be integrated with BigQuery, enabling seamless data aggregation in preparation for the analysis phase.
So we conclude that both of these tools have their dynamics and the choice is based on the needs of each business.
In fact, there are cases where a company can even use them in combination.
In a Nutshell
So we explored in detail what Looker and Tableau are, what their features are, as well as how they differ from each other.
The choice of the right BI tool depends on the needs of each business that is called upon to consider different aspects, such as business objectives, data sources, integrations, and collaboration.
The field of data science offers many career opportunities and good-paying jobs.
So if you're involved in this subject and want to enrich your knowledge, read more related articles on our blog!
.jpg)