

Time Series Analysis: A Comprehensive Guide
For as long as data is being recorded by a company's data analysts, time becomes a critical variable that is taken into consideration.
In today's article, we’ll focus on time series analysis and we’ll discuss how it helps businesses better understand the underlying causes of trends over time.
Let's start by looking at what time series analysis is before delving into types, techniques, and some use cases for a deeper understanding.
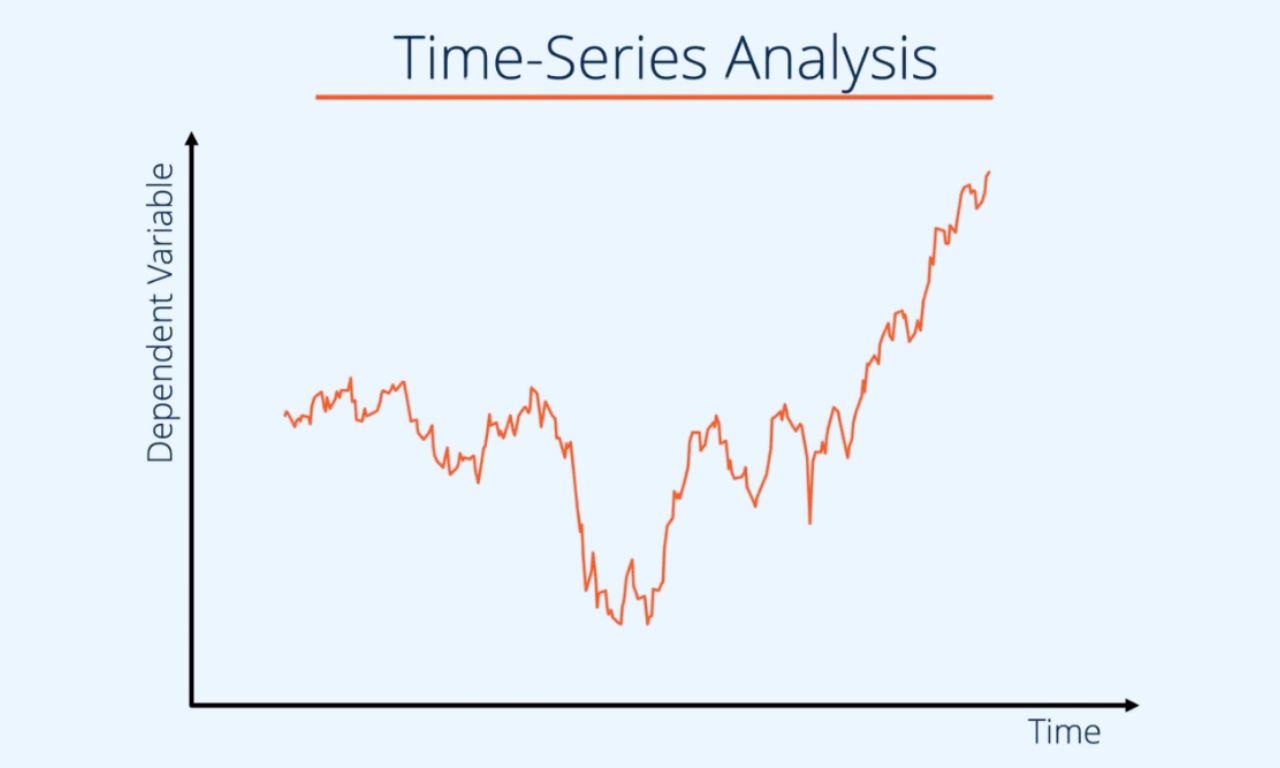
What is Time Series Analysis?
Time series analysis is a method used to analyze a sequence of data points collected and recorded over a defined period, rather than at intervals or randomly.
The primary goals for data analysts using this technique are:
- Understanding the underlying structure of time-dependent data
- Making predictions
- Identifying patterns and trends that can lead to strategic decision-making by businesses
Time series analysis typically requires a large number of data points to ensure completeness, accuracy, and reliability.
Larger datasets provide more representative samples, explaining potential seasonal variations.
Having covered some basics of time series analysis, let's proceed to explore the types, techniques, and use cases.
Basic Types of Time Series Analysis
Some fundamental types of time series analysis include:
Classification: Determines and assigns categories to data.
Curve Fitting: Plots data along a curve to study variable relationships within the data.
Descriptive Analytics: Identifies patterns in time series data, such as trends and seasonal fluctuations.
Segmentation: Divides data into segments to reveal underlying properties of the source data.
Intervention Analysis: Explores how an event can change the data.
Now, beyond the types of time series analysis, let's look at the basic models.
Basic Time Series Analysis Models
The 3 fundamental models/techniques for time series analysis are:
Box-Jenkins ARIMA Models
Box-Jenkins ARIMA Models are univariate and focus on using past behavior and errors for modeling time series data.
These models work under the assumption that the data is stationary.
Multivariate Box-Jenkins Models
Multivariate Box-Jenkins Models are similar to the ARIMA models but represent multiple variables.
Holt-Winters Exponential Smoothing
Holt-Winters Exponential Smoothing is a suitable method for data with distinct trends and seasonality.
Use Cases of Time Series Analysis
Time series analysis is applied to data that exhibits continuous fluctuations over time.
Let's explore some key use cases:
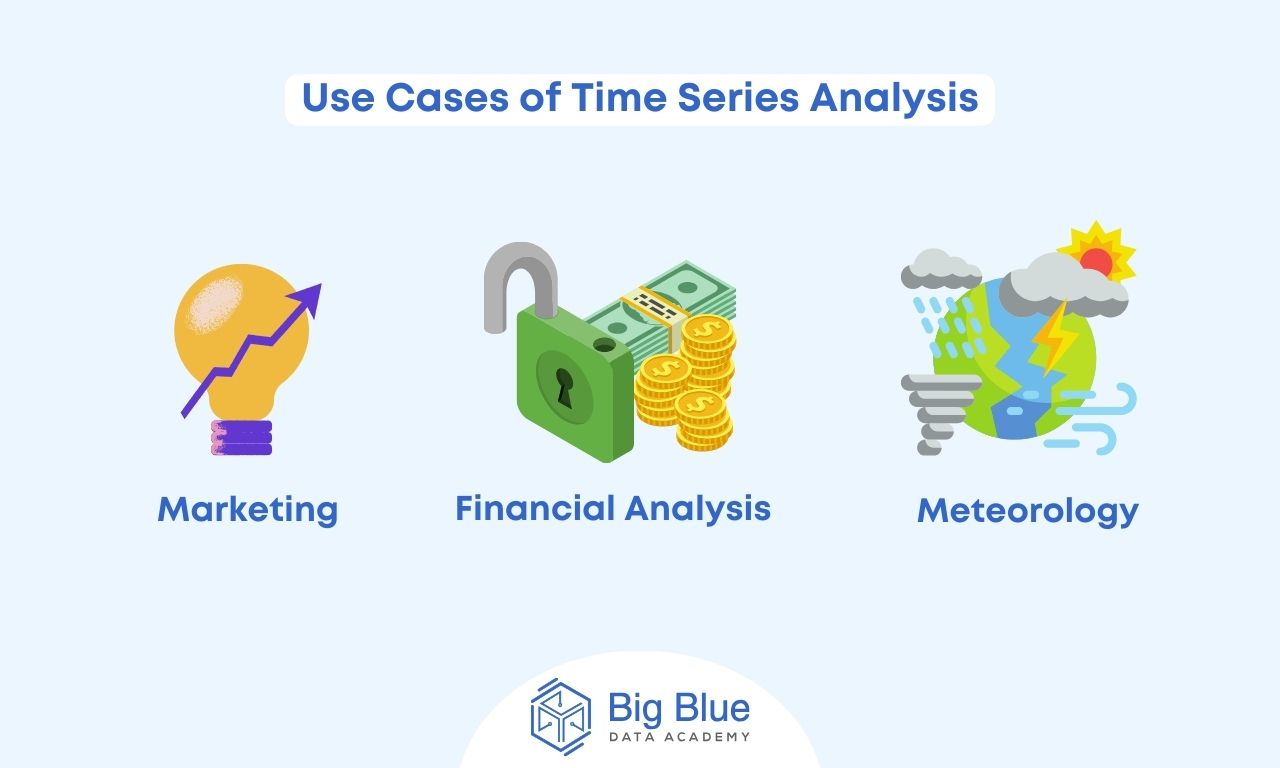
Financial Analysis
Time series analysis is particularly valuable for financial analysts in the financial sector.
This is because the currency driving the economy changes over time.
Therefore, time series analysis proves valuable for analyzing stock prices, exchange rates, and economic indicators for prediction and well-informed investment decisions.
Marketing
Time series analysis is extensively used in marketing for sales forecasting and predicting overall product demand.
It optimizes inventory management and marketing strategies.
Python, a popular programming language for trend analysis and forecasting is widely used in time series analysis.
Meteorology
Another field where time series analysis is highly effective is meteorology.
This method is used for weather data analysis and predicting weather changes.
It assists meteorologists in forecasting future climate conditions and even estimating the impacts of climate change.
Ramping Up
In conclusion, we've discussed time series analysis and covered some basic techniques and applications of this method.
The field of data analysis offers many career opportunities due to its high demand and excellent financial rewards.
So, if you are intrigued and want to learn more about the fascinating and promising sector of data analytics follow us and we’ll keep you updated with more educational articles!
.jpg)