

Sales Optimization with predictive modeling using Artificial Intelligence (AI)
Pricing decisions are crucial for any business, as pricing is directly linked to consumer demand and company profits. Consequently, sales forecasting is critical for every company, especially in the food industry. The objective of this project was to predict sales and estimate the impact of promotional initiatives in an effort to optimize pricing. Sotiris Archontas created and tested sales forecasting models and concluded that the impact of own pricing was far greater compared to the impact of competitor pricing. Furthermore, there is a delay between the promo event and the increase in sales as well as a saturation point, after which promotional events no longer impact sales. Model testing revealed that sales forecasting can be significantly improved using larger and more detailed data sets.
Case Study Contents
1. Background
2. The challenge: Optimizing sales for Food Manufacturer
3. Getting started
4. The workflow
Creating prediction models
Data used for Preprocessing
5. Phase 1: Studying the impact of selected parameters on sales
Impact of product price on sales
Impact of competitors pricing on sales
Impact of ad promotions on sales
6. Phase 2: Creating Prediction Models
Model 1: Sales as Time Series
7. Phase 3: Testing our Sales Prediction Models
Testing Model 1
Testing Model 2
Feature Engineering: Impact of promotion
1. Background
Witside is a technology company using Data management, Data Visualization, and Advanced Analytics to provide consultation services. Witside helps companies "measure tomorrow" and use data to achieve cost optimization, additional revenue, optimized processes, and enhanced customer experience. The company offers end-to-end forecasting solutions combining internal historical data with outside data to improve the accuracy of forecasting models. Witside's work is based on a unique framework consisting of 4 steps:
Step 1: Validate Data
Step 2: Produce Baseline Forecast
Step 3: Embed exogenous variables and produce actual forecasts
Step 4: Operationalize
Deploying AI-driven software solutions Witside enables companies to perform effortless forecasting, embedding their personal experience or calendar events that affect its accuracy.
The objective of this project was sales optimization for a Food Company using AI-driven predictive modeling.
Sales optimization in the food industry is a multifaceted topic, and Witside, in collaboration with Big Blue Data Academy, assigned Sotiris Archontas the sales forecasting and optimization project. Using the data provided, he created models that enabled the extraction of information about parameters affecting sales.
Note: For data protection reasons, the identity of products is not presented, and the sales volume is scaled or hidden.
2. The challenge: Optimizing sales for Food Manufacturer
Sales forecast is a critical business factor for companies of all sizes, as it enables them to forecast demand and develop effective pricing and promotion strategies. In addition, given the complexity of pricing in the dynamic market conditions of the food industry, modeling can provide valuable insights that help companies improve their decision-making processes.
3. Getting started
At the initial stage of our project, we studied the effect of the following parameters on sales:
The prices set by the food company that assigned the project.
The prices set by competitors in the market.
The presence or not of advertising campaigns per week.
4. The workflow
Creating prediction models.
The first step was to create models that predict future sales and estimate the effect of the advertising promotions. To perform the analysis, we used data that included
Volume of sales
Client product prices
Competitor product prices
We also used data relevant to the advertising promotions of the company:
The volume of sales that took place the week after the promotional event.
The impact of promotions on sales of company products
Data used for Preprocessing
The data used for preprocessing included 6 product categories including:
28 customer products
1374 competitors' products
The available data had the following duration:
The duration of sales data was 156 weeks data for sales (3 years)
Promo data had a duration of 52 weeks data (1 year)
Initial analysis: finding a correlation between client and competitor products.
The first challenge of the project was to establish a correlation between our client's products and the competitors' products.
5. Phase 1: Studying the impact of selected parameters on sales
Impact of product price on sales
We studied the effect of product price on sales over a year and had the outcome presented in Graph 1 below.
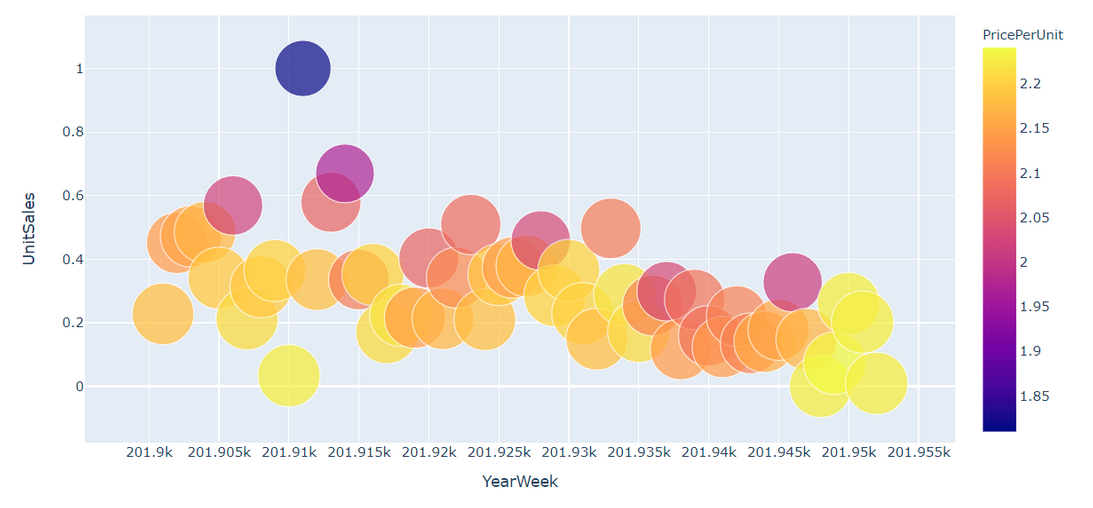
Graph 1: Impact of product price on sales
Darker color dots signify lower prices, and we can see in Graph 1 that low prices lead to increased sales - a finding that was to be expected.
Impact of competitors pricing on sales
We studied the effect of competitor prices on sales over a year and had the outcome presented in Graph 2 below.
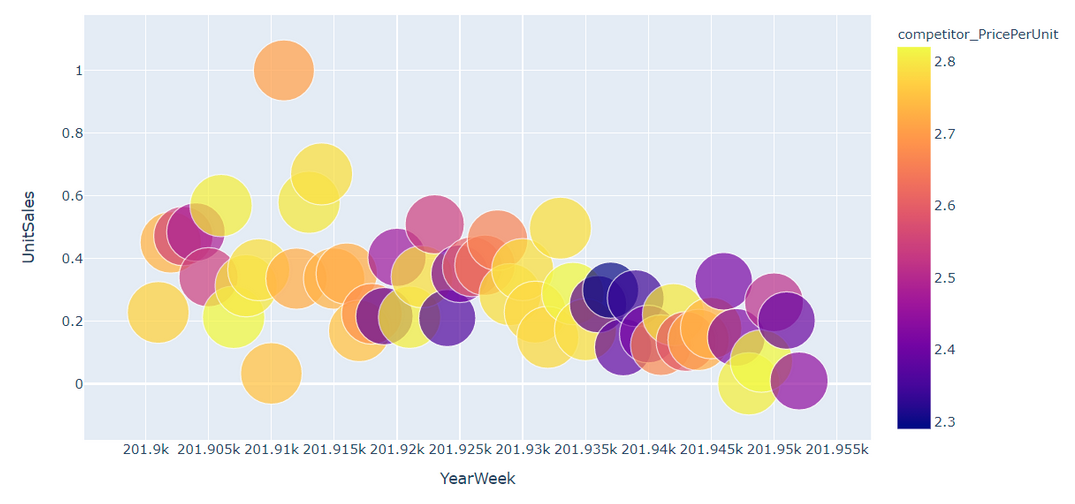
Graph 2: Impact of competitors pricing on sales
Comparing our sales against competitor pricing showed no correlation between the two parameters. In theory, we would expect our sales to increase when the competitor price goes up, but we didn't see something like that for the duration of our data.
Impact of ad promotions on sales
In Graph 3, we see the volume of sales in correlation to the occurrence of a promo ad.
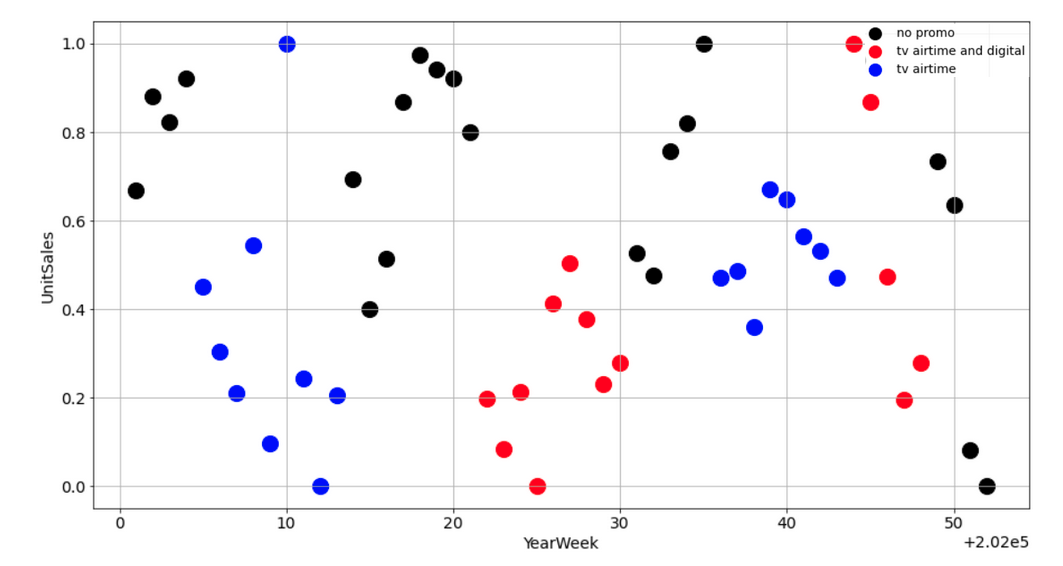
Graph 3: Impact of ad promotions on sales
Blue dots: weeks with ad promo on tv
Red dots: weeks with more than one ongoing promo – tv, digital, etc.
Black dots: weeks with no promo
Conclusions based on Graph 3
Conclusion 1 – Time-lapse
Based on the data displayed in Graph 3 there is a time-lapse between a promotional event and an increase in sales. Thus, we see sales increasing 3 to 4 weeks after the advertising promotion took place.
Conclusion 2 – Promo saturation
Based on the analysis on Graph 3, it becomes apparent that promo campaigns need to have a specific duration for optimized results. After a number of weeks, we see a saturation point where sales decrease despite promo campaigns.
6. Phase 2: Creating Prediction Models
Following our analysis, we created and tested predictive models for sales forecasting.
Model 1: Sales as Time Series
For our first model, we approached sales as time series, as seen in Graph 4 below.
Actual vs. Predicted sales
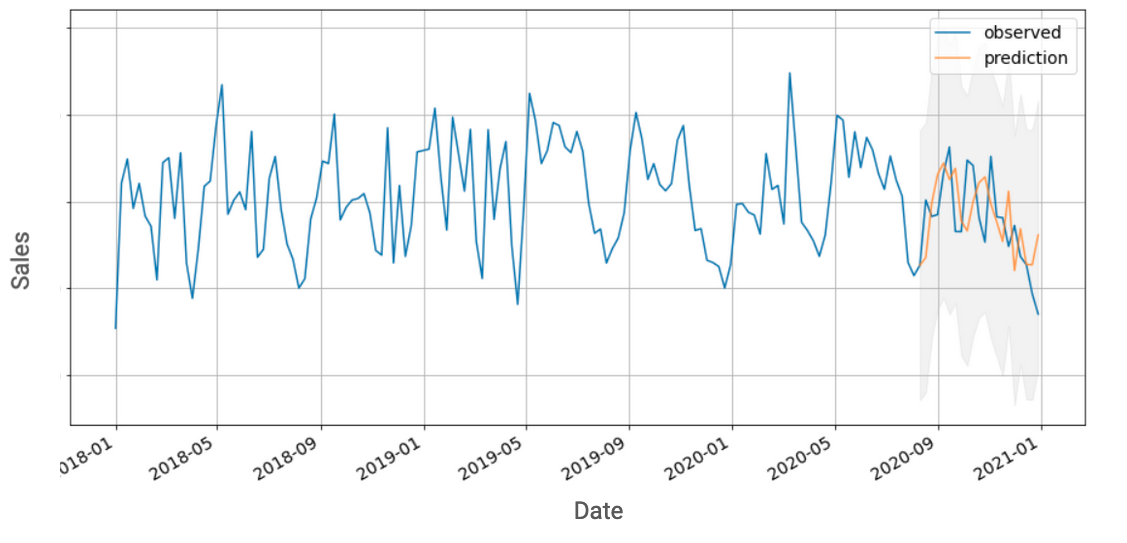
Graph 4: Time Series Prediction
Blue line: Real-time series for sales for a 3-year duration.
Orange line: Prediction provided by ARIMA model
Time Series prediction – results
Based on Graph 4, we conclude that initially, we have a relatively accurate prediction that captures the peak in actual prices. The prediction accuracy of the model is considered to be good. However, over time there is a lapse to the right of the prediction line compared to the actual. This is attributed to the fact that we don't have sufficient data that would enable us to build a more accurate Time Series Prediction Model.
7. Phase 3: Testing our Sales Prediction Models
Testing Model 1
For Model 1, we used Random Forest Regressor.
Input data for Model 1 were:
Prices of our client company
The price difference between our company and the competitor
Competitor Sales for a specific product
Result/Output: The expected/predicted sum of sales.
Model 1 Optimisation
In order to optimize Model 1, we excluded Trend and Seasonality from the original Sales Time Series.
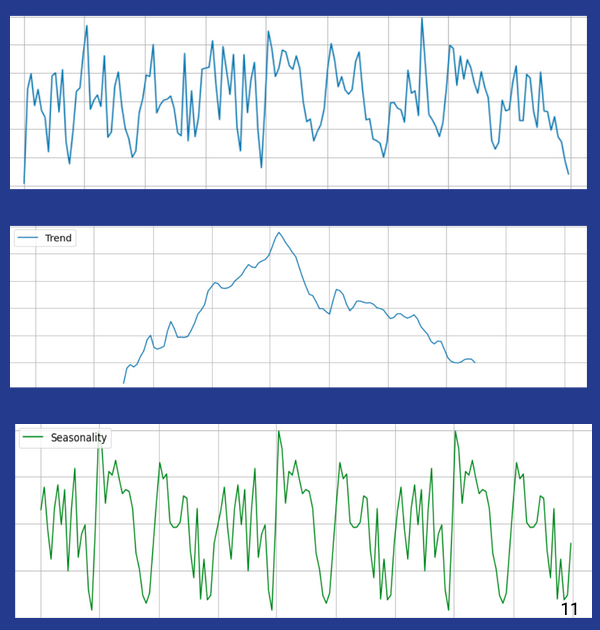
Graph 5 Decomposition of seasonality and trend
By removing a small percentage of seasonality from sales, we saw an improvement in the model and concluded to R2 = 0,69
Testing Model 2
For our second testing model, we added to our modeling one more input feature: the existence or not of an ongoing promotional campaign.
Input data for Model 2 were:
Prices of our client company
The price difference between our company and the competitor
Competitor Sales for a specific product
AND the existence or not of an ongoing promotional campaign.
Result/Output: The expected/predicted sum of sales.
The result of our model was R2 = 0.59
This comes in correlation with the analysis of
the effect of advertising.
the necessary duration to have a real impact on sales.
This feature type is very simple, so we created more columns to help the model better understand the impact of the ad promotions.
Feature Engineering: Impact of advertisement promo
The new columns included:
Sales shift
Consecutive days of promo
Consecutive days of promo shift
Moving average
Conclusion: We did not observe an improvement in the model as the available data was not sufficient. Data provided on promotional events only spanned over a year – 52 weeks, so our model had only 52 rows.
8. Key takeaways
The impact of our company's pricing was far greater compared to the impact of the competitors' prices.
We observed a delay between the promo event and the increase in sales.
There is a saturation point, after which promotional events no longer impact sales.
Recommendations to improve predictive models
More sales and promo data would significantly improve our predictive models.
Having the same promotional campaign happening at different time periods would provide valuable data, as it would help us understand if the increase in sales is attributed to promo or seasonality.
Daily data would help a lot towards training our models compared to using weekly data.
9. Online presentation
You can see Sotiris Archodas's final data science project presentation here.
For more information on Big Blue Data Academy projects, you can contact us here.
Invitation
Companies in Greece are invited to participate in the Big Blue Training Process and assign data-driven projects to Bootcamp students.
.jpg)